PHP ProjectsSoftware Projects
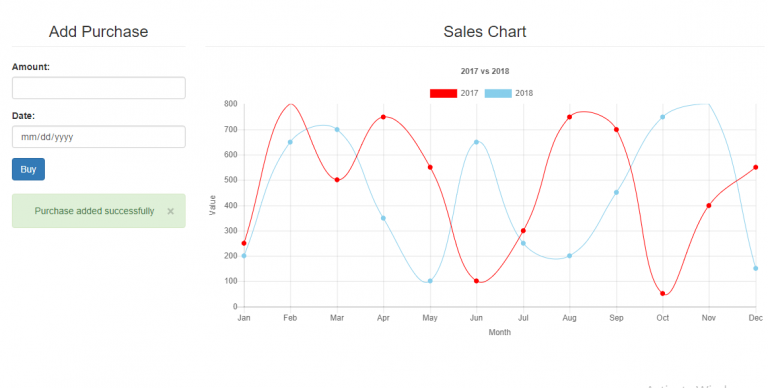
Line Chart using ChartJS AngularJS and PHP MySQLi Database
I’ve used CDN for Bootstrap, AngularJS and ChartJS, so you need an internet connection for them to work.
Creating Database
First, we’re going to create our MySQL Database to fetch data, from:
1. Open phpMyAdmin.
2. Click databases, create a database and name it as angular.
3. After creating a database, click the SQL and paste the below codes. See image below for detailed instruction.
CREATE TABLE `sales` (
  `saleid` int(11) NOT NULL AUTO_INCREMENT,
  `amount` double NOT NULL,
  `sale_date` datetime NOT NULL,
PRIMARY KEY(`saleid`)
) ENGINE=InnoDB DEFAULT CHARSET=latin1;INSERT INTO `sales` (`saleid`, `amount`, `sale_date`) VALUES
(17, 50, '2018-01-01 16:00:00'),
(18, 600, '2018-02-01 16:00:00'),
(19, 50, '2018-02-04 16:00:00'),
(20, 700, '2018-03-02 16:00:00'),
(21, 350, '2018-04-03 16:00:00'),
(22, 100, '2018-05-04 16:00:00'),
(23, 650, '2018-06-05 16:00:00'),
(24, 250, '2018-07-06 16:00:00'),
(25, 200, '2018-08-07 16:00:00'),
(26, 450, '2018-09-08 16:00:00'),
(27, 750, '2018-10-09 16:00:00'),
(28, 800, '2018-11-10 16:00:00'),
(29, 150, '2018-12-11 16:00:00'),
(30, 50, '2018-01-06 16:00:00'),
(31, 50, '2018-01-16 16:00:00'),
(32, 40, '2018-01-01 16:00:00'),
(33, 10, '2018-01-21 16:00:00'),
(34, 250, '2017-01-04 16:00:00'),
(35, 800, '2017-02-01 16:00:00'),
(36, 500, '2017-03-02 16:00:00'),
(37, 750, '2017-04-03 16:00:00'),
(38, 550, '2017-05-04 16:00:00'),
(39, 100, '2017-06-05 16:00:00'),
(40, 300, '2017-07-06 16:00:00'),
(41, 750, '2017-08-07 16:00:00'),
(42, 700, '2017-09-08 16:00:00'),
(43, 50, '2017-10-09 16:00:00'),
(44, 400, '2017-11-10 16:00:00'),
(45, 550, '2017-12-11 16:00:00');Index.html
<!DOCTYPE html>
<html ng-app="app">
<head>
    <title>Line Chart using ChartJS, AngularJS and PHP/MySQLi</title>
    <meta charset="utf-8">
    <link href="https://maxcdn.bootstrapcdn.com/bootstrap/3.3.7/css/bootstrap.min.css" rel="stylesheet">
    <script src="http://ajax.googleapis.com/ajax/libs/angularjs/1.5.7/angular.min.js"></script>
    <script src="https://cdnjs.cloudflare.com/ajax/libs/Chart.js/2.7.1/Chart.bundle.min.js"></script>
    <style type="text/css">
        canvas{
            margin:auto;
        }
        .alert{
            margin-top:20px;
        }
    </style>
</head>
<body ng-controller="myCtrl">
<div class="container">
    <div class="row">
        <div class="col-sm-3" ng-init="fetchfruit()">
            <h3 class="page-header text-center">Add Purchase</h3>
            <div class="form-group">
                <label>Amount:</label>
                <input type="text" class="form-control" ng-model="buy.amount">
            </div>
            <div class="form-group">
                <label>Date:</label>
                <input type="date" class="form-control" ng-model="buy.date">
            </div>
            <button type="button" ng-click="purchase()" class="btn btn-primary">Buy</button>
            <div class="alert alert-success text-center" ng-show="success">
                <button type="button" class="close" aria-hidden="true" ng-click="clear()">×</button>
                {{ message }}
            </div>
            <div class="alert alert-danger text-center" ng-show="error">
                <button type="button" class="close" aria-hidden="true" ng-click="clear()">×</button>
                {{ message }}
            </div>
        </div>
        <div class="col-sm-9" ng-init="fetchsales()">
            <h3 class="page-header text-center">Sales Chart</h3>
            <canvas id="dvCanvas" height="150" width="300"></canvas>
        </div>
    </div>
</div>
<script src="app.js"></script>
</body>
</html>
App.js
var app = angular.module('app', []);

app.controller('myCtrl', function ($scope, $http) {

    $scope.error = false;
    $scope.success = false;

    $scope.purchase = function(){
        $http.post('purchase.php', $scope.buy)
        .success(function(data){
            if(data.error){
                $scope.error = true;
                $scope.success = false;
                $scope.message = data.message;
            }
            else{
                $scope.success = true;
                $scope.error = false;
                $scope.message = data.message;
                $scope.fetchsales();
                $scope.buy = '';
            }
        });
    }

    //this fetches the data for our table
    $scope.fetchsales = function(){
        $http.get('fetchsales.php').success(function(data){

            var ctx = document.getElementById("dvCanvas").getContext('2d');
            var myChart = new Chart(ctx, {
                type: 'line',
                data: {
                    labels: ["Jan", "Feb", "Mar", "Apr", "May", "Jun", "Jul", "Aug", "Sep", "Oct", "Nov", "Dec"],
                    datasets: [
                        {
                            label: '2017',
                            backgroundColor: 'red',
                            borderColor: 'red',
                            data: data.prev,
                            borderWidth: 1,
                            fill: false
                        },
                        {
                            label: '2018',
                            backgroundColor: 'skyblue',
                            borderColor: 'skyblue',
                            data: data.year,
                            borderWidth: 1,
                            fill: false
                        }

                    ]
                },
                options: {
                    responsive: true,
                    title:{
                        display:true,
                        text:'2017 vs 2018'
                    },
                    tooltips: {
                        mode: 'index',
                        intersect: false,
                    },
                    hover: {
                        mode: 'nearest',
                        intersect: true
                    },
                    scales: {
                        xAxes: [{
                            display: true,
                            scaleLabel: {
                                display: true,
                                labelString: 'Month'
                            }
                        }],
                        yAxes: [{
                            display: true,
                            scaleLabel: {
                                display: true,
                                labelString: 'Value'
                            },
                            ticks: {
                                beginAtZero:true
                            }
                        }]
                    }
                }
            });

        });
    }

    $scope.clear = function(){
        $scope.error = false;
        $scope.success = false;
    }

});
Purchase.php
<?php

    $conn = new mysqli("localhost", "root", "", "angular");

    $out = array('error' => false);

    $data = json_decode(file_get_contents("php://input"));

    $amount = $data->amount;
    $date = $data->date;

    $sql = "INSERT INTO sales (amount, sale_date) VALUES ('$amount', '$date')";
    $query = $conn->query($sql);

    if($query){
        $out['message'] = "Purchase added successfully";
    }
    else{
        $out['error'] = true;
        $out['message'] = "Cannot add purchase";
    }

    echo json_encode($out);

?>